A stock price can change thousands of times in a trading day, sometimes even when there is no obvious company announcement. That can make the number on a chart look as though it is being calculated by an exchange, chosen by the company or controlled by a single powerful participant.
In reality, a stock price is produced through price discovery: buyers and sellers submit orders, trading systems compare those orders, and transactions occur when compatible prices meet. The next price can be different because the available orders, quantities and willingness to trade have changed.
Educational note: This guide explains market mechanics using simplified, hypothetical examples. It is not investment advice, a recommendation to trade, or a prediction of how any security will perform. Market rules and terminology vary by country, exchange, broker and data provider.
Quick answer
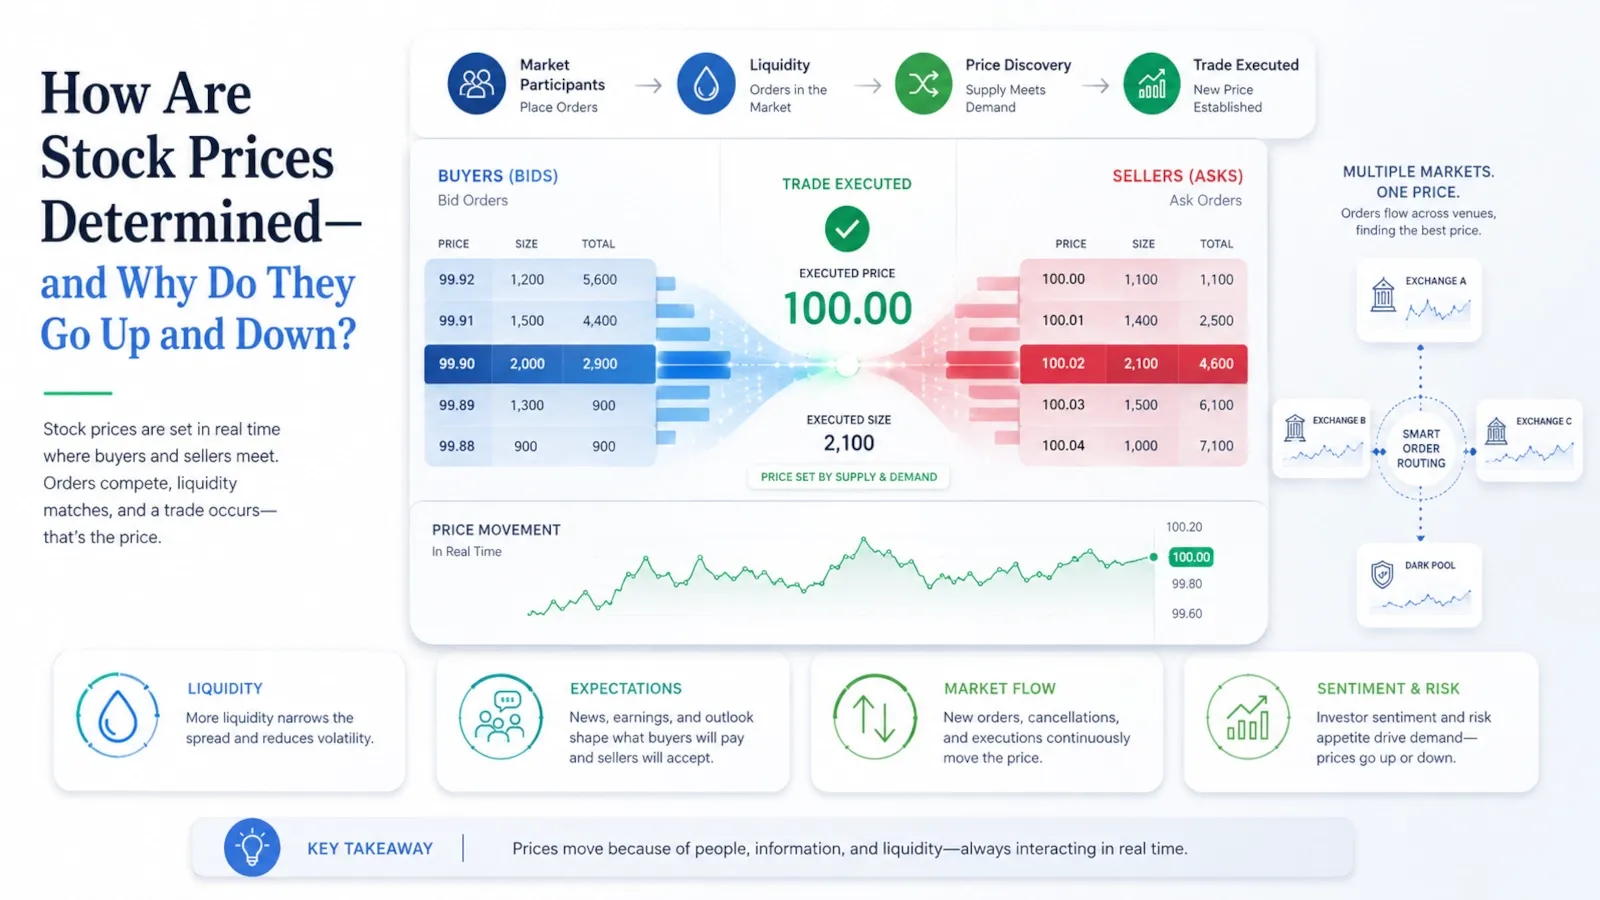
Stock prices are determined through transactions between buyers and sellers. Buyers state the prices they are willing to pay, sellers state the prices they are willing to accept, and a trade can occur when compatible orders meet. The latest eligible reported transaction then becomes a reference for the displayed market price.
Prices go up or down when new information, expectations, liquidity or trading pressure changes the prices and quantities at which participants are willing to trade. No single person, company or exchange continuously decides the price, and there is no universal formula that recalculates it from the company’s profits every second.
When to use this guide
Use this guide when you want to understand:
- who determines the price shown on a stock chart;
- whether an exchange or company calculates the price;
- what bid, ask, spread and last price mean;
- how one completed trade can change the displayed price;
- why stocks move after earnings, economic news or interest-rate changes;
- why a stock can move without an obvious headline;
- why good news can still be followed by a falling share price;
- why share price is not the same as company value.
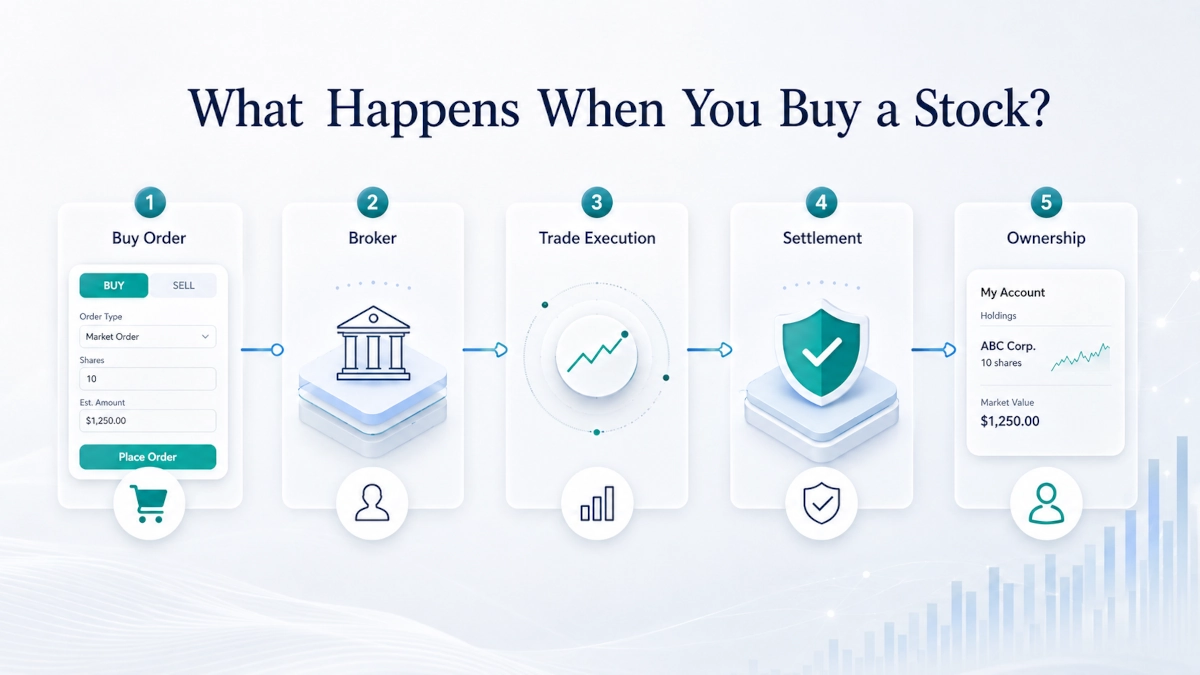
This article focuses on price formation and price movement. For the broader system of exchanges, brokers, clearing and ownership, read How Does the Stock Market Work?. To follow an individual purchase from order placement to ownership, read What Happens When You Buy a Stock?.
Before you start
Keep four distinctions in mind:
- A market price is an observed trading price, not a guaranteed estimate of intrinsic value.
- A quote is not the same as a completed trade. Bid and ask prices show current trading interest; the last price reports a previous transaction.
- An order is not guaranteed to execute at the number you saw. Prices and available quantities can change before execution.
- The order-book examples below are simplified. Modern equity markets can route and execute orders across multiple exchanges and off-exchange venues.
How a stock price is determined in one simple model
The basic process is:
Buyers submit bids
        +
Sellers submit offers
        ↓
Compatible orders meet
        ↓
A trade is executed
        ↓
The transaction becomes a price reference
        ↓
New orders and expectations influence the next trade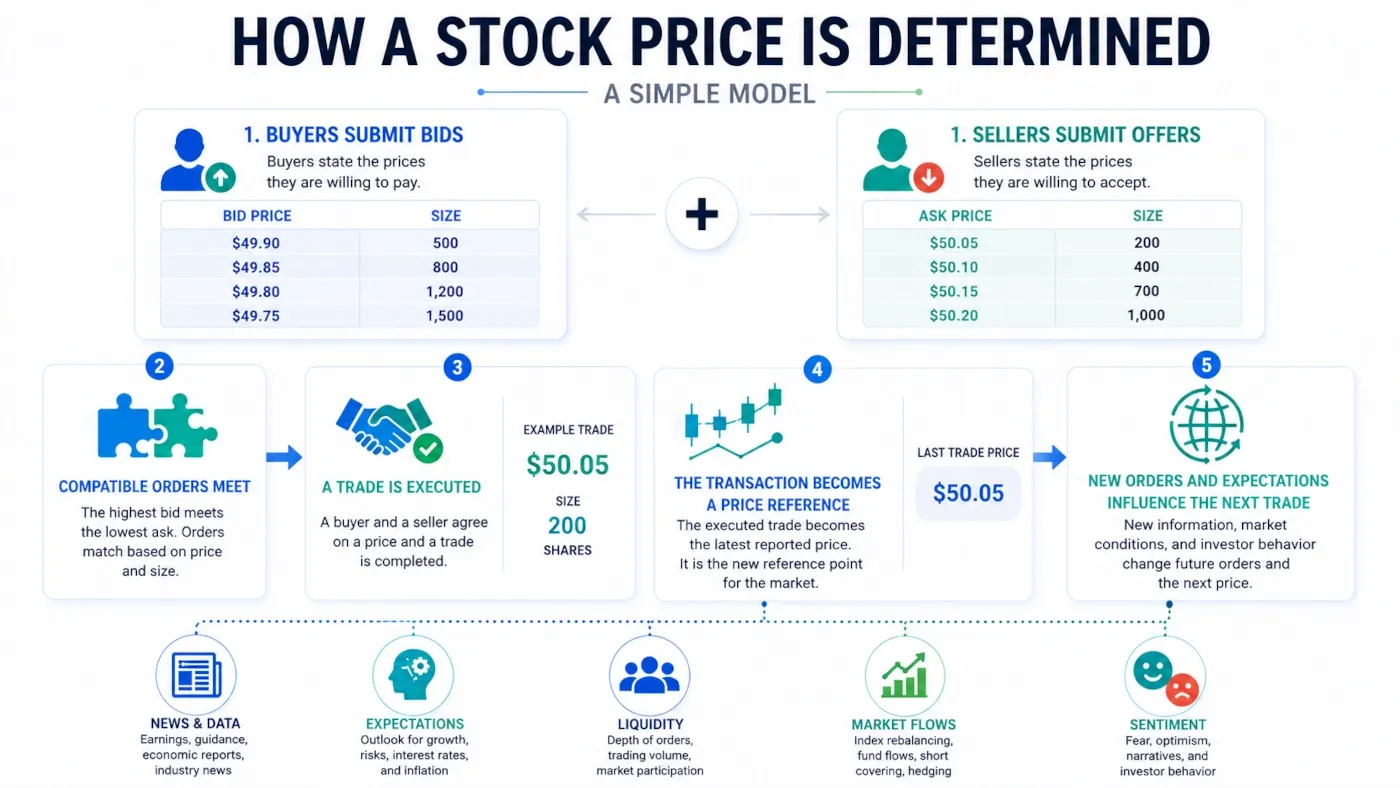
This is called price discovery. The market is continually discovering the prices at which participants are willing to exchange shares now—not calculating one objectively correct value for the business.
The process can be described step by step:
1. Investors decide whether they want to buy, sell or wait
Their decisions may reflect company results, economic conditions, portfolio needs, risk limits, valuation estimates, news, rumours or market sentiment.
2. Orders enter the market
An order includes at least a direction—buy or sell—and a quantity. Depending on the order type, it may also include a price limit and instructions about timing or execution.
3. Brokers route orders to execution venues
A broker may send an order to an exchange, a market maker, an alternative trading system or another eligible venue. Routing arrangements and market structure differ across jurisdictions.
4. Compatible buying and selling interest is matched
A trade occurs when a buyer and seller can agree on a price under the applicable market rules. That may happen immediately or only after one side changes its price.
5. The completed trade is reported
The reported transaction contributes to the market’s record of trading activity. A broker or chart may display a consolidated last sale, a venue-specific last trade, a delayed quote or another reference, depending on the product and data feed.
6. The process starts again
The remaining orders may differ from those available before the trade. New orders may also arrive, causing the next execution to occur at a higher, lower or unchanged price.
Who decides stock prices?
No single person continuously decides a stock price.
The price emerges from the interaction of many participants and systems:
- Investors and traders decide the prices and quantities they are willing to buy or sell.
- Brokers receive customer orders and route them for execution.
- Exchanges and electronic systems organise quotes, match eligible orders and publish market data under their rules.
- Market makers and other liquidity providers quote prices or trade against incoming orders, helping connect buyers and sellers.
- Alternative trading systems and off-exchange venues provide additional places where transactions can occur.
- Opening and closing auctions aggregate orders at specific times to establish official opening or closing prices under venue rules.
The company itself does not continuously choose its secondary-market share price. It can still influence the market by reporting results, issuing guidance, paying dividends, repurchasing shares, issuing new shares, completing mergers or making other decisions that change expectations or the supply of shares.
An exchange also does not simply decide what the company is worth. It provides rules and infrastructure through which trading interest interacts.
Is a stock price calculated by a formula?
There is no universal formula that continuously calculates the market price of a publicly traded stock.
Several numbers are often confused with one another:
| Concept | What it means |
|---|---|
| Market price | A price created by trading or shown through current market quotes |
| Valuation estimate | An analyst’s or investor’s estimate based on assumptions about future cash flows, earnings, risk or comparable companies |
| Market capitalisation | Current share price multiplied by total shares outstanding |
| IPO offer price | The initial sale price established through the public-offering process before regular secondary-market trading begins |
| Reference price | An informational benchmark used in particular trading, listing or auction processes |
Valuation formulas can influence what investors are willing to bid or ask, but they do not force the next trade to happen at a particular number. Two well-informed investors can use different assumptions and reach different estimates of value.
What price do you actually see on a stock screen?
A stock screen can display several different prices. Understanding the label is essential.
| Term | Meaning |
|---|---|
| Bid | The highest displayed price at which a buyer is currently willing to buy a stated quantity |
| Ask or offer | The lowest displayed price at which a seller is currently willing to sell a stated quantity |
| Spread | The difference between the bid and ask |
| Last price | The price of the latest eligible reported transaction shown by the data feed |
| Midpoint | The halfway point between bid and ask; it is a calculation, not necessarily a trade |
| Quote | Current market information that can include bid, ask, quantities and venue identifiers |
| Execution price | The actual price obtained for a completed order |
| Previous close | The prior session’s official closing price, which may differ from later extended-hours trades |
Investor.gov defines the bid as the highest price a buyer will pay and the ask as the lowest price a seller will accept. The difference is the spread.
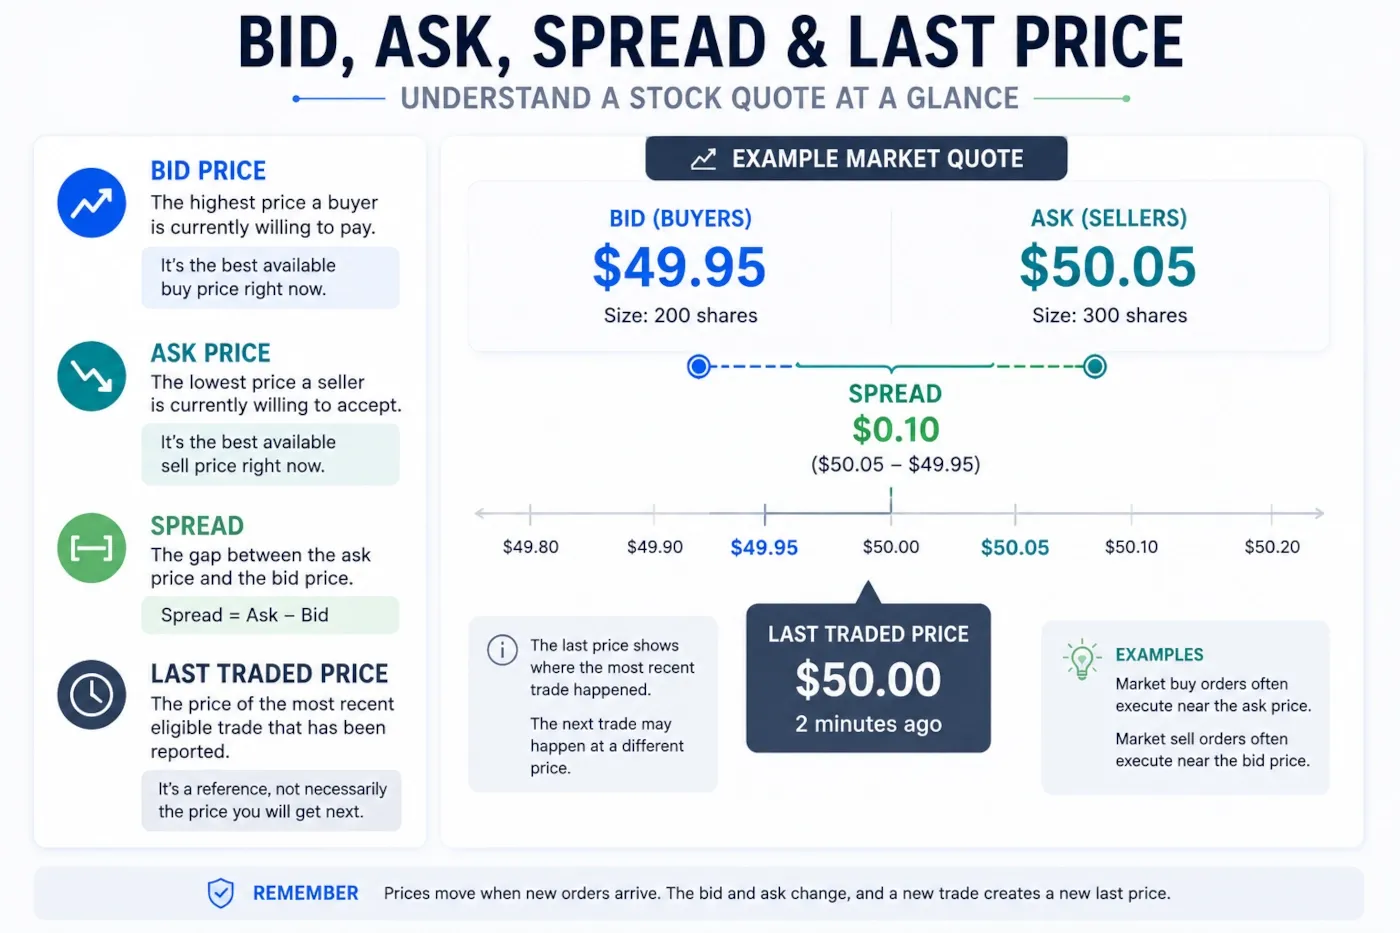
The most important practical rule is:
The last traded price is not a promise that your next order will execute at that price.
Investor.gov warns that a market order guarantees neither a specific execution price nor execution at the last-traded price. Quotes apply to particular quantities, and the market may change before an order arrives.
How bids and asks create a trade
Consider this simplified market:
Highest bid: $49.95 for 100 shares
Lowest ask:  $50.05 for 100 shares
Spread:      $0.10
At this moment, the best displayed buyer is offering $49.95, while the best displayed seller is asking $50.05. They have not agreed, so there is no trade between those two orders yet.
A limit buyer at $49.95
A buy limit order at $49.95 normally joins the buying interest at that price. It can execute only at $49.95 or lower, but execution is not guaranteed.
A market buyer
A market buy order prioritises immediate execution over a guaranteed price. If the $50.05 offer is still available when the order reaches the venue, the buyer may trade against it.
A seller who lowers the asking price
A seller could submit an order that accepts the $49.95 bid. The trade could then occur at that bid, depending on routing, priority and venue rules.
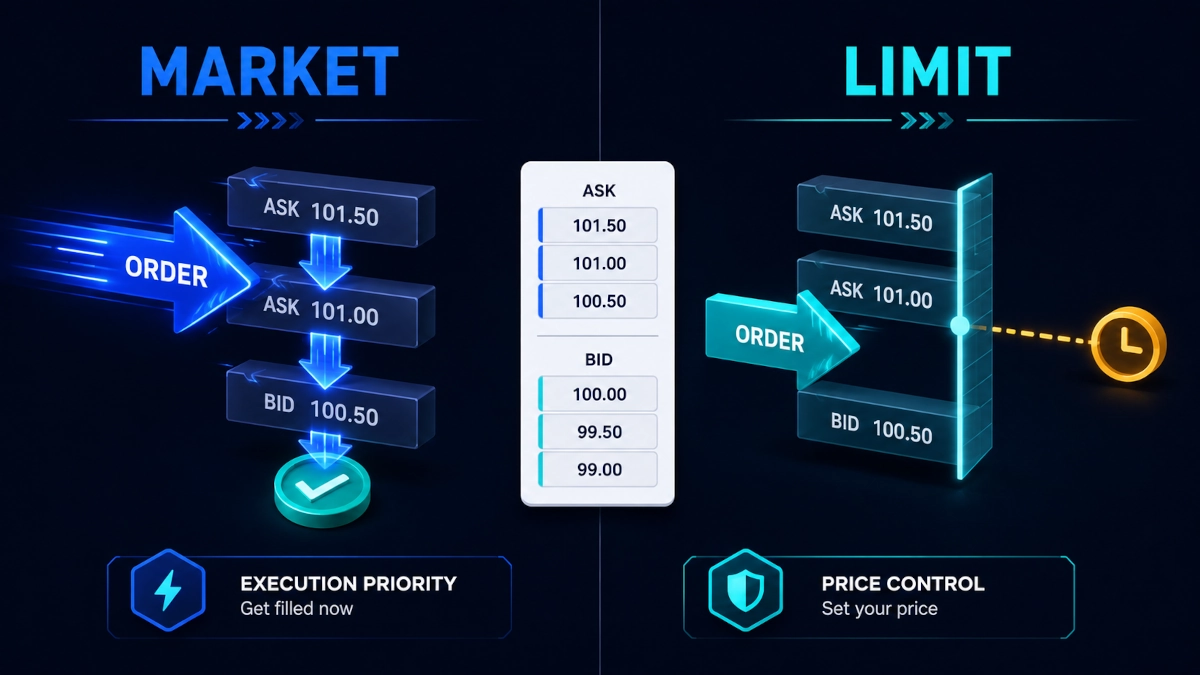
The difference between faster execution and price control is explained in more detail in Market Order vs. Limit Order.
How a trade moves the displayed price
Now assume the sell side contains:
Ask side

100 shares at $50.05
200 shares at $50.10
300 shares at $50.20
A market buy for 100 shares might be filled at $50.05 if that quantity is still available.
A market buy for 400 shares is larger than the quantity offered at the best ask. In this simplified example it could fill as follows:
100 shares × $50.05 = $5,005
200 shares × $50.10 = $10,020
100 shares × $50.20 = $5,020
--------------------------------
400 shares              $20,045
The average execution price would be:
$20,045 ÷ 400 = $50.1125 per shareThe order has consumed several price levels. Later executions may therefore occur at $50.20 or another price unless new sellers arrive at lower levels.
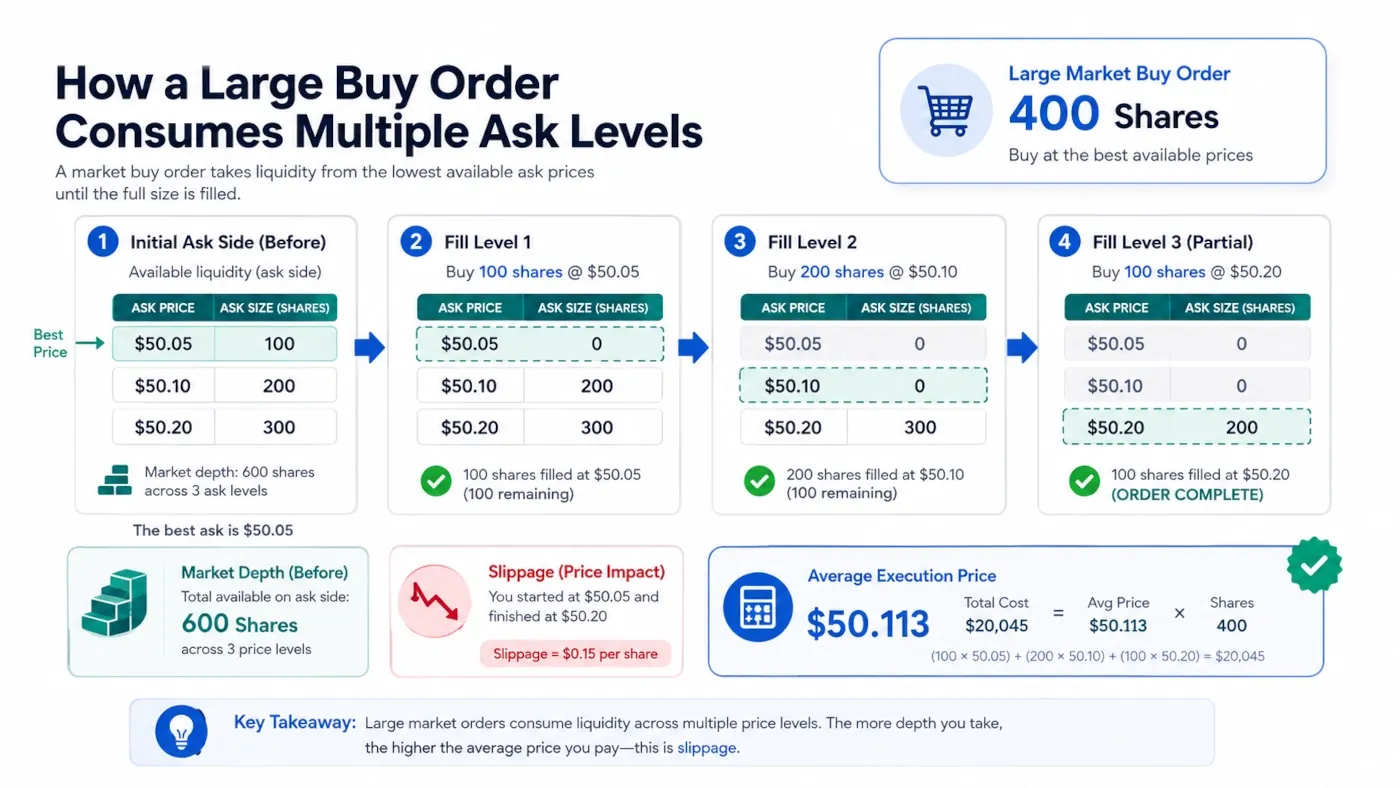
This illustrates three related ideas:
- Market depth: how much quantity is available at different prices;
- Slippage: the difference between an expected price and the average or final execution price;
- Market impact: the extent to which an order changes available quotes or trading prices.
Real executions can be more complex. An order may be routed to several venues, partially filled, price-improved, cancelled or affected by hidden and non-displayed liquidity.
Does every order appear in one public order book?
No. A single order-book diagram is a useful teaching model, but it is not a complete map of a modern stock market.
FINRA explains that stocks can trade on traditional exchanges and on other execution venues, including alternative trading systems, single-dealer platforms and wholesalers. Some orders are displayed publicly; others may be partly displayed, hidden, held by a broker or executed off-exchange.
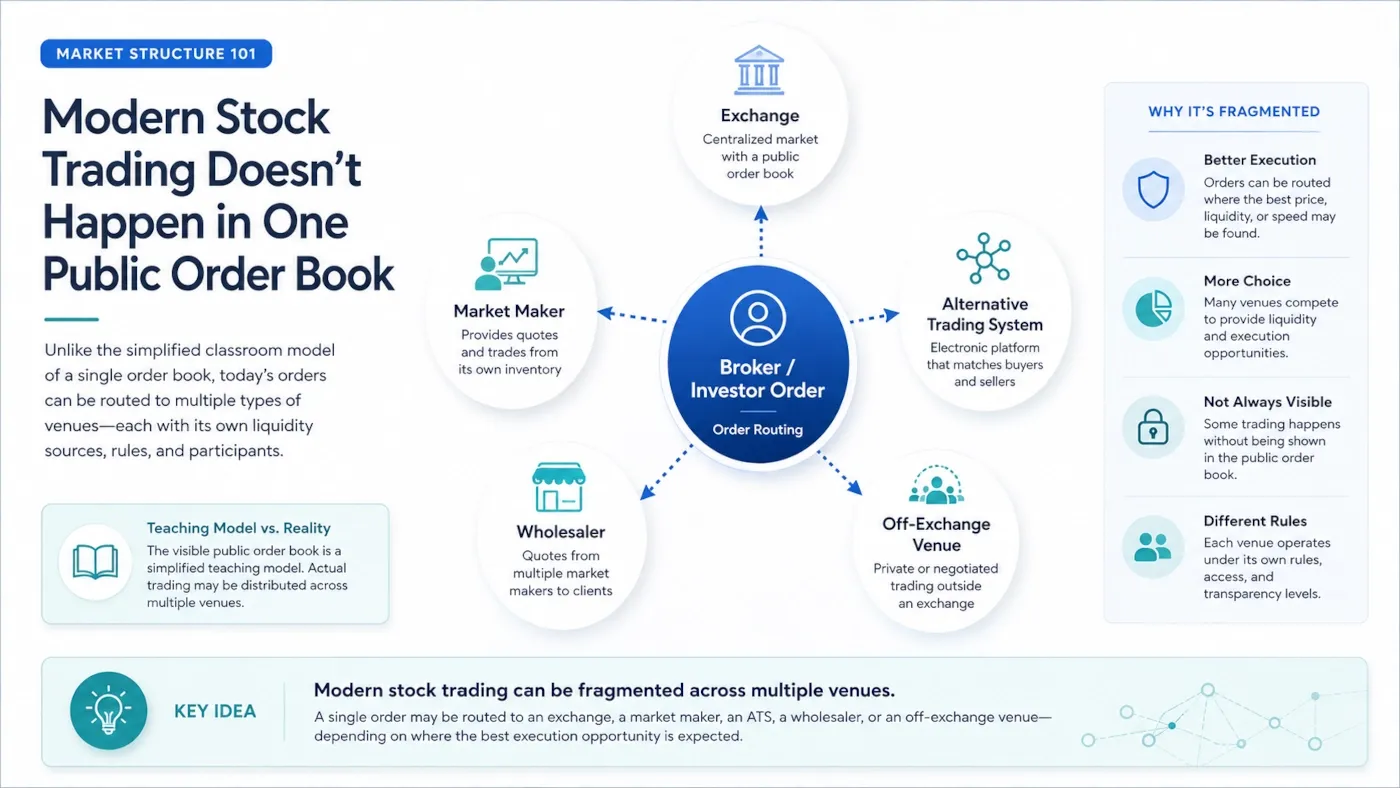
For U.S. listed stocks during regular trading hours, consolidated market data can show the national best bid and offer and consolidated last-sale information. That consolidated view is still not the same as seeing every order or every source of potential liquidity.
This matters because:
- the visible best quote may represent only a limited quantity;
- additional interest may exist at other venues or prices;
- some liquidity is not displayed before execution;
- quotes can be updated or cancelled;
- the price shown by one platform may be delayed or venue-specific.
Therefore, a visible block of orders should not automatically be treated as a permanent “support” or “resistance” level.
Why do stock prices go up and down?
Stock prices move because participants change the prices and quantities at which they are willing to trade.
A common explanation says:
More buyers → price rises
More sellers → price falls
That is too imprecise. Every completed trade has both a buyer and a seller. What matters is the urgency of one side relative to the liquidity available on the other side.
A more accurate explanation is:
Aggressive buying relative to available selling liquidity
can push executions to higher prices.

Aggressive selling relative to available buying liquidity
can push executions to lower prices.
For example, a price can rise when buyers repeatedly accept higher offers because sellers are unwilling to sell at the previous price. It can fall when sellers repeatedly accept lower bids because buyers are unwilling to pay the previous price.
What causes investors to change their orders?
The trading mechanism explains how the price changes. The following factors help explain why participants change their bids, offers and quantities.
Company performance
Investors continually reassess a company’s ability to generate cash and returns. Relevant information can include:
- revenue growth or contraction;
- profit and operating margins;
- free cash flow;
- debt and refinancing needs;
- customer demand;
- product quality or recalls;
- competitive position;
- management credibility;
- capital spending;
- legal or regulatory exposure.
Expectations and guidance
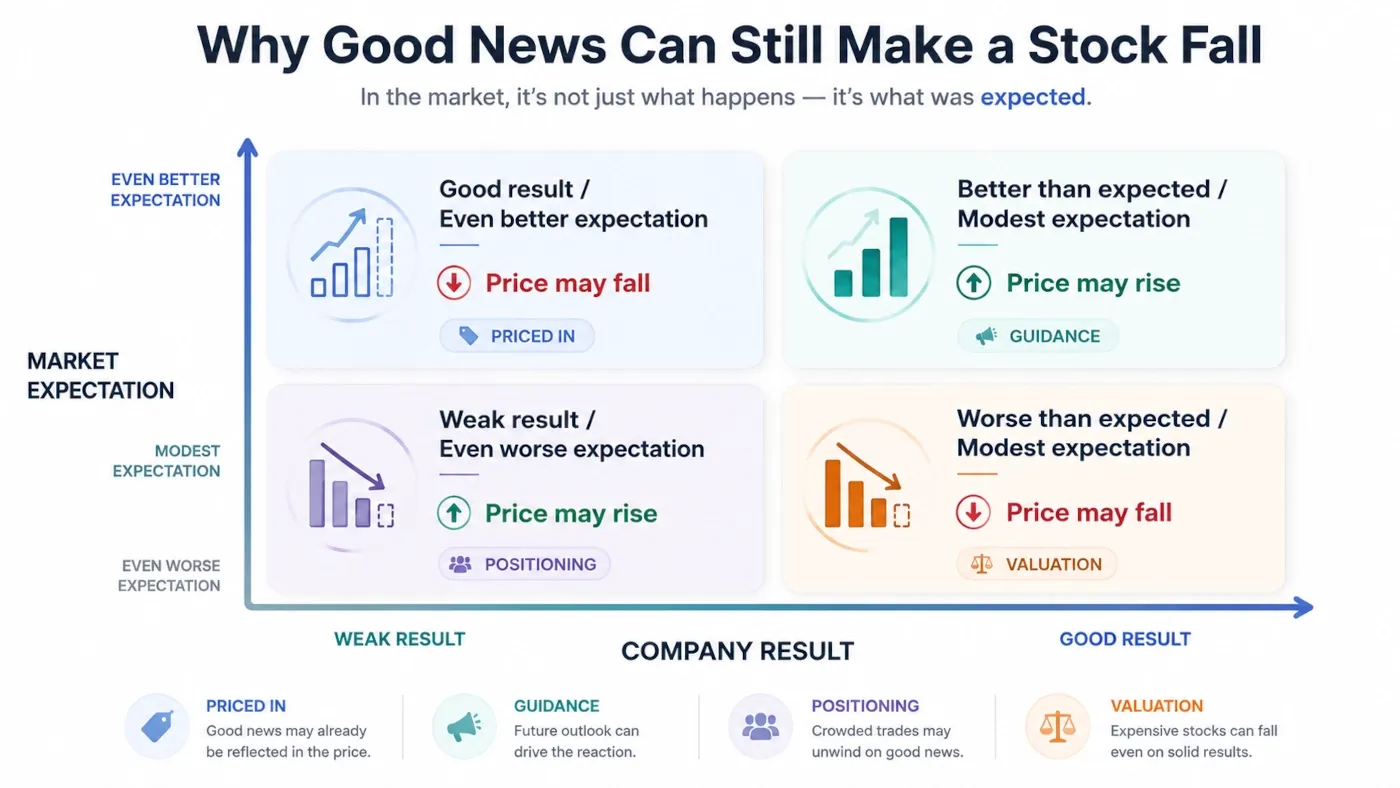
Prices respond not only to what happened, but also to how the result compares with what market participants expected.
Reported result
        versus
Prior market expectation
A company can report higher earnings and still fall if investors expected an even stronger result, if management lowers its outlook, or if the shares were already priced for near-perfect performance.
The reverse is also possible: weak results can be followed by a rising price if the outcome was less bad than feared or if future guidance improves.
Interest rates
Interest rates can affect stocks through several channels:
- companies may face higher or lower borrowing costs;
- consumers may change spending and borrowing;
- investors may change the return they require for taking equity risk;
- future cash flows may be valued differently when discount rates change;
- bonds and cash may become relatively more or less attractive.
These effects are not identical for every company. A bank, a highly indebted business and a fast-growing technology company can react differently to the same rate change.
Economic conditions
Important economic information can include:
- inflation;
- employment;
- household spending;
- business investment;
- economic growth;
- recession risk;
- credit availability;
- exchange rates.
Markets often react to what economic data imply for future profits, policy and interest rates—not simply whether a number looks “good” or “bad” in isolation.
Industry and geopolitical developments
A stock can move because of developments affecting its entire industry or supply chain:
- new regulation;
- changing commodity prices;
- trade restrictions;
- wars or political instability;
- new competitors;
- technological disruption;
- shortages or transport problems;
- changes in consumer preferences.
Corporate actions
Companies can change the number, distribution or characteristics of their shares through:
- dividends;
- share repurchases;
- new share issuance;
- mergers and acquisitions;
- spin-offs;
- stock splits and reverse splits.
These events can change cash flows, ownership percentages, available supply or investor expectations. Their effects should not be reduced to a simple rule such as “buybacks always raise the price” or “splits create value.”
Market flows and positioning
Prices can also move because investors need to trade for reasons that are not a new opinion about the company:
- index rebalancing;
- inflows or withdrawals from funds and ETFs;
- portfolio risk reductions;
- margin calls;
- forced selling;
- short covering;
- options hedging;
- end-of-month or end-of-quarter rebalancing.
A large fund may sell a sound company because the fund has redemptions or must reduce exposure. The sale can affect the price even though the company’s products and financial statements have not changed that day.
Sentiment and narratives
Fear, optimism, momentum, social media and changing narratives can influence short-term trading behaviour. Sentiment is not separate from supply and demand; it changes the orders that participants submit.
Narratives can sometimes move faster than verifiable facts. This is one reason a price movement should not automatically be treated as proof that a particular rumour is true.
Why can a stock move with no obvious news?
The absence of a public headline does not mean that nothing is affecting trading.
A stock may move because of:
- a broad market or sector move;
- a large portfolio rebalance;
- changes in interest rates, currencies or commodity prices;
- an index or ETF adjustment;
- options-related hedging;
- short covering;
- a large order meeting limited liquidity;
- opening or closing auction imbalances;
- a comparable company reporting results;
- rumours or information being interpreted unevenly;
- technical failures, data corrections or unusual trading conditions.
Sometimes several small forces overlap. There may be no single explanation that can be proven from public data.
Be cautious when a news headline confidently attributes a move to one cause. The explanation may be plausible without being demonstrated.
Why can good news make a stock fall?
A market reaction depends heavily on expectations, valuation and positioning.
| Company result | Prior expectation | Possible reaction |
|---|---|---|
| Good | Even better | Price may fall |
| Weak | Even worse | Price may rise |
| Better than expected | Modest | Price may rise |
| Worse than expected | Modest | Price may fall |
A positive announcement may already be priced in, meaning many participants bought in anticipation of it. When the announcement arrives, some may take profits—a pattern sometimes described as “buy the rumour, sell the news.” That phrase describes a possibility, not a law.
Other reasons for a fall after apparently good news include:
- weaker future guidance;
- lower margins or cash flow quality;
- a valuation that already assumed faster growth;
- a one-off gain that does not improve the underlying business;
- cautious management commentary;
- crowded investor positioning.
How liquidity affects stock prices
Liquidity describes how readily an asset can be traded in meaningful size without a large change in price.
| More liquid stock | Less liquid stock |
|---|---|
| More competing orders | Fewer available orders |
| Often a narrower spread | Often a wider spread |
| Greater visible and hidden depth | Less depth at each price |
| Moderate orders may be absorbed more easily | One order may cross several price levels |
| Prices may adjust in smaller increments | Prices may jump between sparse quotes |
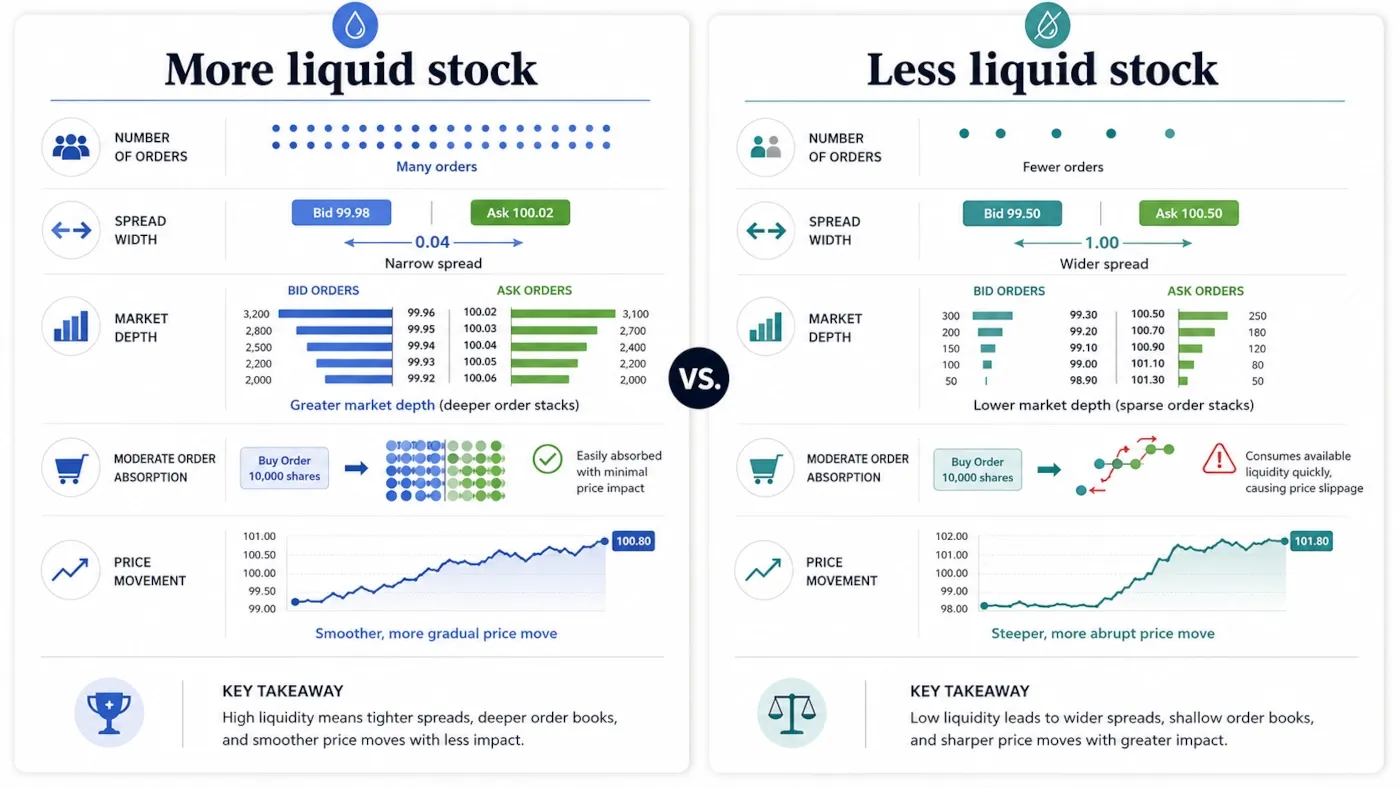
Liquidity is not fixed. It can change with time of day, volatility, news and the willingness of market makers and other participants to quote.
Regular hours versus extended hours
Pre-market and after-hours sessions often have fewer participants, wider spreads and more fragmented trading. FINRA warns that extended-hours trading can be less liquid, more volatile and less connected across venues.
A price seen after hours may therefore differ substantially from the next official opening price. Brokers may also restrict available securities, venues and order types outside regular hours.
How opening and closing prices are determined
Official opening and closing prices may be established through auctions, rather than by simply copying the previous trade.
In an auction, eligible buy and sell orders are gathered and evaluated under the venue’s rules. The auction process seeks a price at which compatible interest can be matched, often with objectives such as maximising executable volume and resolving imbalances according to published procedures.
The NYSE describes opening and closing auctions as price-discovery events, while the Nasdaq Opening and Closing Crosses establish Nasdaq official opening and closing prices.
This helps explain why:
- a stock can open well above or below the previous close;
- overnight news can produce a price gap;
- the official close can differ from trades that occur seconds earlier;
- after-hours trades do not necessarily determine the next official opening price.
Auction methods vary by exchange and security, so there is no single global opening-price formula.
Stock price versus company value
A stock’s market price and a company’s estimated value are related concepts, but they are not the same thing.
Market price
= an observable quote or completed trading price

Estimated value
= a judgement based on assumptions about the company's future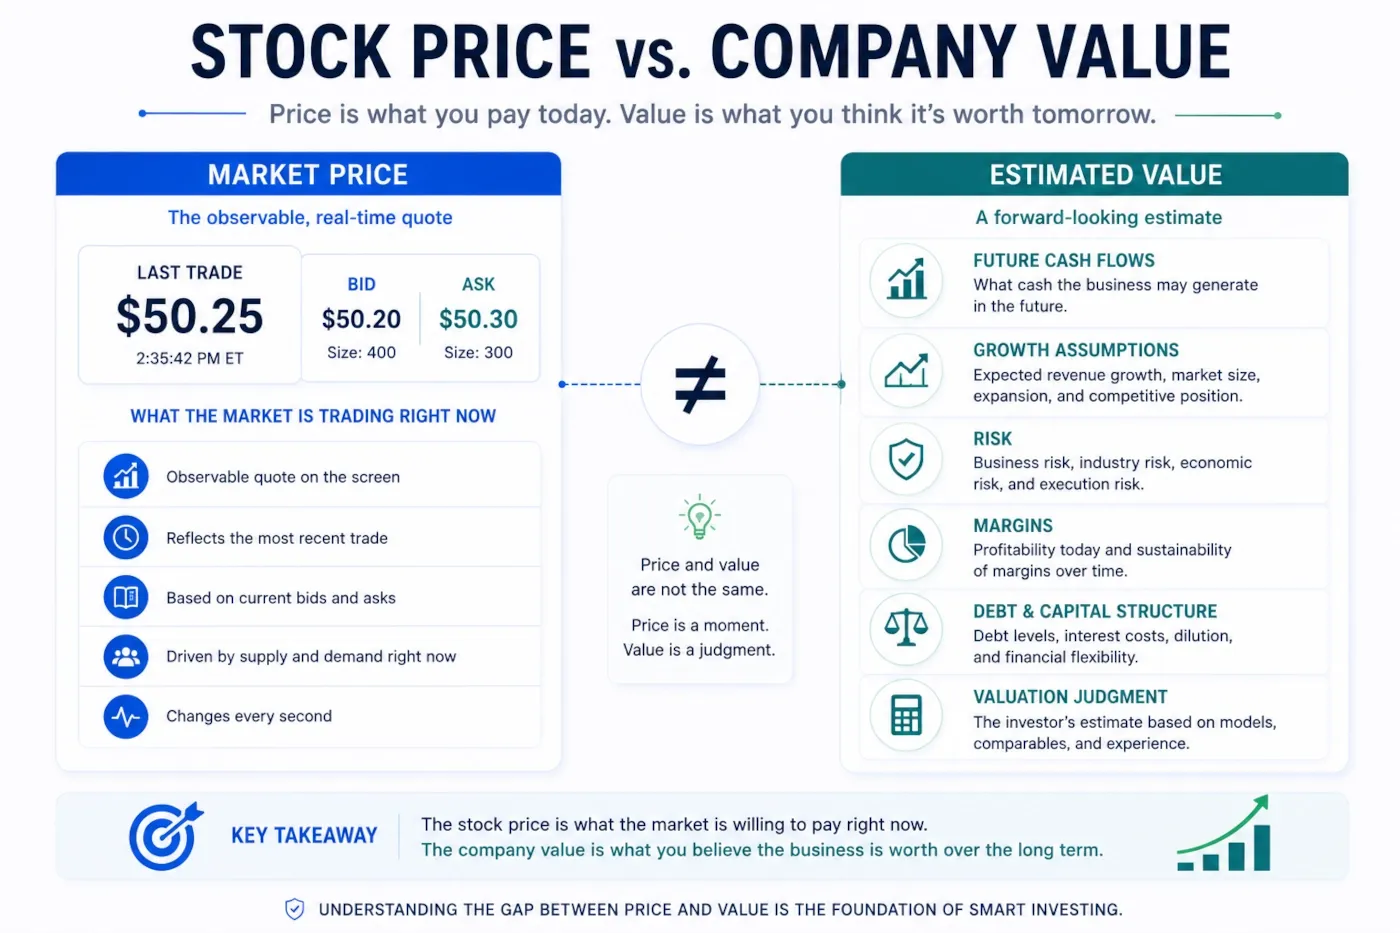
An investor estimating value may consider future cash flows, growth, margins, debt, risk and alternative investments. Another investor can use different assumptions and reach a different conclusion.
Important consequences follow:
- a rising price does not prove that the business improved by the same amount;
- a falling price does not necessarily mean the company is failing;
- a low price per share does not automatically mean the stock is cheap;
- a high price per share does not automatically mean the company is expensive;
- there is no perfectly observable “true value” known to all participants;
- price and a particular valuation estimate are not guaranteed to converge quickly—or at all.
Over longer periods, business performance and cash-generating ability may exert a stronger influence on valuation, but positive returns are never guaranteed.
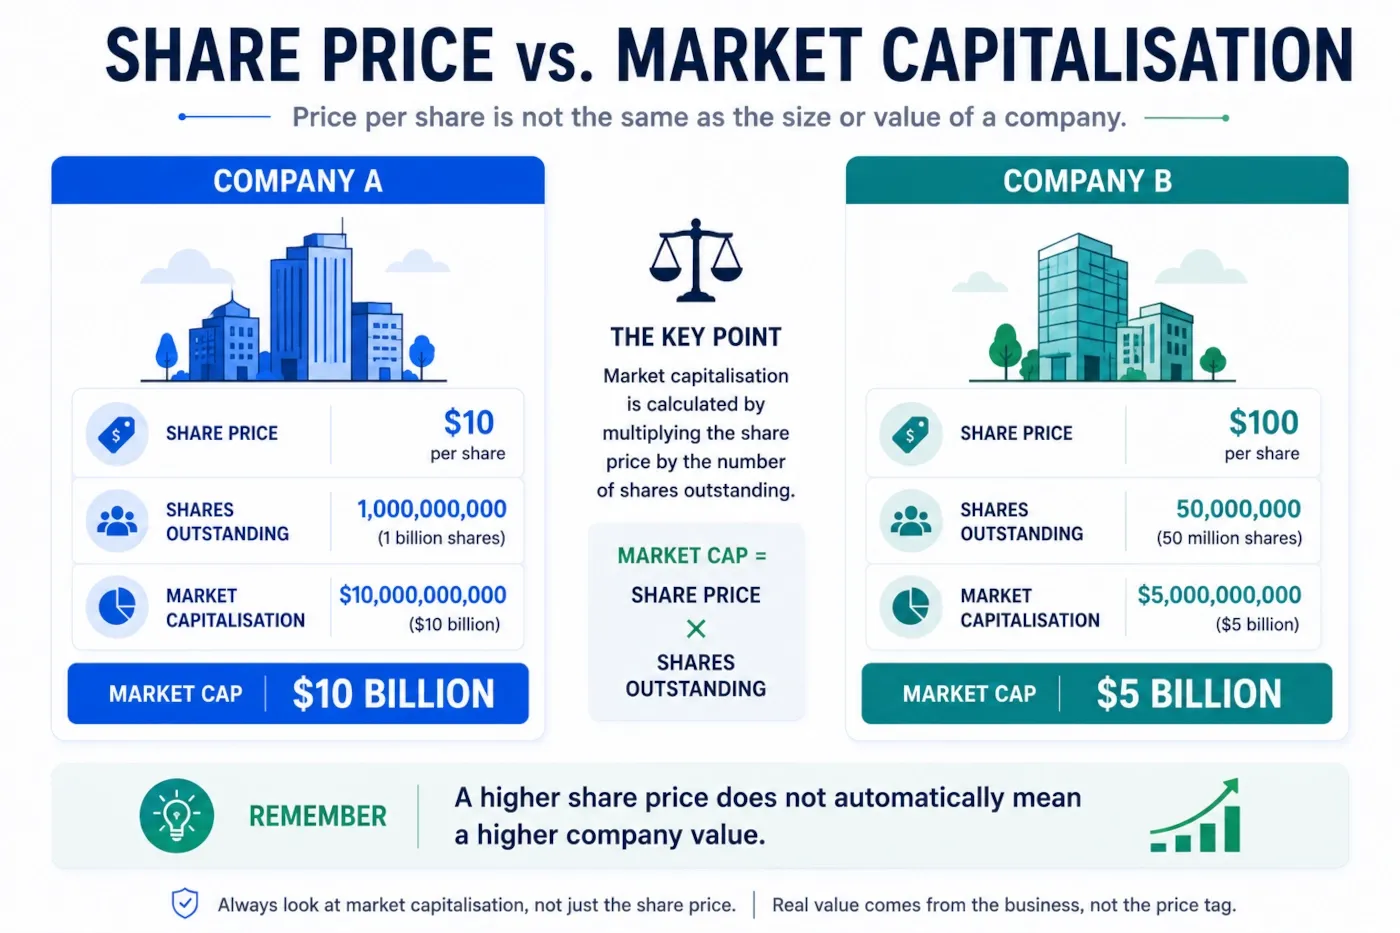
Stock price versus market capitalisation
Share price alone cannot tell you how large or expensive a company is as a whole.
Consider two hypothetical companies:
Company A
$10 per share × 1 billion shares
= $10 billion market capitalisation

Company B
$100 per share × 50 million shares
= $5 billion market capitalisation
Company B has the higher share price, but Company A has the larger total equity market value.
This is also why a stock split does not automatically create economic value. In a two-for-one split, the number of shares doubles while the per-share price is adjusted proportionally, all else being equal. Investor.gov describes a stock split as increasing the number of shares without changing shareholders’ equity.
Individual stocks versus the whole stock market
An individual stock is influenced by several layers:
Company-specific factors
+ industry factors
+ broad market and economic factors
A stock-market index combines the performance of multiple constituents according to its methodology. Some indices weight companies by market capitalisation; others use different rules.
Therefore, “Why did this stock fall?” and “Why did the stock market fall?” are related but not identical questions. A company can rise during a weak market because of strong company-specific news, while a sound company can fall because of a broad risk-off move.
Short-term price movements versus long-term business performance
Different forces can dominate over different periods.
| Short-term influences | Longer-term business influences |
|---|---|
| Order flow | Revenue growth |
| News surprises | Profitability |
| Liquidity | Cash generation |
| Sentiment | Debt and financing capacity |
| Positioning | Competitive advantages |
| Forced trading | Capital allocation |
| Options hedging | Ability to reinvest or distribute cash |
This distinction should not be interpreted as “short-term prices are meaningless” or “good companies must eventually rise.” A business can perform well while its stock produces disappointing returns if the starting valuation was too high, expectations change or new risks emerge.
Three complete examples
The following examples are hypothetical and intentionally simplified.
Example 1: A large market order changes the execution price
A stock shows:
100 shares offered at $30.00
200 shares offered at $30.05
500 shares offered at $30.15
An investor sends a market order to buy 600 shares. If no other liquidity appears and the quotes remain available, the order may execute across all three levels:
100 at $30.00
200 at $30.05
300 at $30.15
The last fill occurs at $30.15, and the average execution price is above the initial best ask. The order did not “prove” the company became more valuable; it encountered limited supply at the first price levels.
Example 2: Earnings rise, but the stock falls
Before the report:
Expected earnings per share: $2.00
Expected guidance: strong double-digit growth
Valuation: already assumes rapid expansion
The company reports:
Actual earnings per share: $2.10
New guidance: slower growth next quarter
The earnings figure beat the consensus estimate, but the outlook disappointed investors. Some buyers withdraw, some holders sell, bids fall and the next trades occur at lower prices.
The headline “earnings beat” was true, but incomplete.
Example 3: No company news, but the stock drops
Assume a mid-sized company has no announcement. On the same day:
- its entire sector falls;
- an index fund rebalances;
- a large holder must sell;
- available bids are relatively thin.
The seller accepts progressively lower bids, producing a 4% decline. The business itself may not have changed that day, but order flow and available liquidity did.
Common mistakes
“The company chooses its daily share price”
The company can influence expectations and share supply, but secondary-market transactions set the trading price.
“The exchange calculates the price from a fixed formula”
Exchanges apply trading and auction rules. Continuous prices emerge from orders and executions rather than from one valuation equation.
“More buyers than sellers is the complete explanation”
Every trade contains both sides. The relevant issue is which side is more aggressive relative to available liquidity and at what prices.
“The last price is the price everyone can receive”
The last price describes a previous eligible trade. Your execution depends on current quotes, quantity, routing, timing and order type.
“All orders appear in one public order book”
Modern markets include multiple exchanges and off-exchange venues, and not all trading interest is displayed.
“Good earnings always make a stock rise”
The reaction depends on expectations, guidance, valuation and positioning.
“No news means there is no reason for the move”
Portfolio flows, sector moves, derivatives hedging, liquidity and auctions can affect price without a company headline.
“A lower share price means the company is cheaper”
Share price must be considered alongside shares outstanding, financial performance and valuation.
“A stock split makes the company more valuable”
A conventional split changes the number of shares and the price per share proportionally, without automatically changing shareholders’ equity.
“High trading volume means the price must rise”
Volume measures shares traded. Heavy trading can accompany a rise, a fall or little net price movement.
“Market makers can freely choose any price they want”
Market makers participate by quoting and trading under market and regulatory rules. They can affect available liquidity, but they do not possess unlimited power to set an arbitrary sustainable market price. Artificially distorting supply, demand, quotes or trades can constitute market manipulation.
Practical checklist for understanding a price move
When a stock moves sharply, use this sequence:
- Check whether the move is company-specific. Compare the stock with its sector and major indices.
- Look for primary information. Review company filings, earnings releases, guidance and corporate actions.
- Compare the news with prior expectations. A result is meaningful only relative to what was priced in.
- Check the timing. Regular hours, pre-market, after-hours and auctions can have different liquidity.
- Look at bid, ask and spread—not only the last price. A wide spread can make a quote misleading.
- Consider volume and depth. High volume does not reveal direction by itself, while limited depth can amplify an order’s impact.
- Check for index, ETF or portfolio flows. Trading may be mechanical rather than a new judgement about the business.
- Treat media explanations as hypotheses. The first narrative may be plausible without being proven.
Security, privacy and financial safety notes
Stock-price movements attract rumours, scams and emotionally charged claims. Protect yourself by following these principles:
- Do not make a financial decision solely because a chart moved sharply.
- Do not assume social-media posts, anonymous messages or screenshots contain verified information.
- Check whether a quote is real-time, delayed, regular-hours or extended-hours data.
- Remember that market orders prioritise execution, not a guaranteed price, especially in fast or illiquid markets.
- Review your broker’s order disclosures and extended-hours rules before trading.
- Be particularly cautious with thinly traded, low-priced or aggressively promoted stocks.
- Never share brokerage passwords, authentication codes, recovery codes or account statements with people claiming they can explain or reverse a loss.
The SEC defines market manipulation as artificially affecting supply or demand for a security, including through false information or transactions designed to create a misleading impression of trading activity.
Faster alternative: the 60-second explanation
For a quick mental model, remember this:
1. Buyers submit bids.
2. Sellers submit offers.
3. A trade occurs when compatible prices meet.
4. That execution becomes a market-price reference.
5. New information and trading needs change the next bids and offers.
6. The next trade may therefore occur higher, lower or unchanged.
This shortcut explains the core mechanism, but it does not show the full effect of multiple venues, hidden liquidity, auctions, expectations or order routing.
FAQ
How are stock prices determined?
Stock prices are determined through trading. Buyers submit prices they are willing to pay, sellers submit prices they are willing to accept, and an execution occurs when compatible interest meets. Reported transactions and current quotes then provide market-price references.
Who decides stock prices?
No single person continuously decides them. Investors, brokers, exchanges, market makers and other venues participate in a price-discovery process governed by orders, available liquidity and market rules.
Is a stock price calculated by a formula?
Not continuously. Valuation formulas can influence investors’ decisions, but the market price comes from quotes and completed trades. Market capitalisation is calculated from price and shares outstanding; it does not calculate the price itself.
Why do stock prices go up and down?
They move when buyers and sellers change the prices and quantities at which they are willing to trade. Aggressive buying can consume available offers and move executions upward; aggressive selling can consume bids and move executions downward.
What causes a stock price to change?
Possible causes include company results, guidance, expectations, interest rates, economic data, industry news, corporate actions, fund flows, liquidity, hedging, sentiment and market-wide moves.
What is the difference between bid, ask and last price?
The bid is the highest current buying price, the ask is the lowest current selling price, and the last price is the price of a previous eligible reported trade. Your next execution can differ from all three.
Can one large order move a stock?
Yes, particularly when available liquidity is limited. A large order may consume several price levels. Its impact depends on order type, size, market depth, routing and whether new orders arrive.
Why does a stock move without news?
It can move because of sector trading, portfolio rebalancing, index flows, options hedging, short covering, large orders, low liquidity or auctions. There may not be one identifiable cause.
Why can a stock fall after good earnings?
The result may be weaker than investors expected, future guidance may disappoint, the positive news may already be priced in, or the stock’s valuation and positioning may have left little room for error.
How is the opening stock price determined?
Many exchanges use an opening auction that aggregates eligible orders and applies venue rules to identify an opening price. The precise method varies by exchange and security.
Why do stocks move after hours?
Companies often release news outside regular hours, and investors react in extended-hours venues. Lower liquidity, wider spreads and disconnected venues can produce larger or less reliable price moves.
Is share price the same as company value?
No. Share price is a market quote or transaction price for one share. Company value can refer to market capitalisation or to an estimated intrinsic value based on assumptions about the business.
Does a stock split make a company more valuable?
Not by itself. A conventional split increases the number of shares and reduces the price per share proportionally, all else being equal. The total economic interest of existing shareholders is not automatically increased.
Can market makers control stock prices?
Market makers can influence short-term liquidity by quoting and trading, but they do not have unrestricted authority to assign any lasting price they choose. Prices reflect interaction across many participants and venues. Artificially distorting supply, demand or trading activity can be illegal manipulation.
Last tested
Tested on:
- U.S. listed equity market structure concepts
- Regular-hours and extended-hours trading concepts
- Investor.gov, FINRA, NYSE, Nasdaq and SEC investor-education materials
Last tested: 2026-08-06
Related guides
Carefully selected guides to help you understand the topic and complete the next useful step.